Hi all,
I realize that there are multiple threads on a similar theme to this, but I feel that none of them seem to contain correct information, and most of them don't really deal with the connection to real life.
So I'm trying to model a car that I have access to in real life. Fun, right? Also a path to insanity, apparently. This is going to be a long thread, and potentially a bit interesting to some people and incredibly boring to others. The car is an old MGA race car.
The first thing I did was head out one evening and carry out acceleration tests and coast-down tests on a perfectly straight and flat piece of tarmac (an airplane runway). I'm using a 10 Hz GPS/GLONASS logger, which is typically pretty reliable. I did repeat runs in both directions, and took note of the wind speed at the time (7 m/s, blowing to the northwest, approx. 3-4 m/s in the direction of the runway).

So far, everything makes sense. Let's look at the coast-down tests, convert everything to m/s, and plot the deceleration as a function of speed.
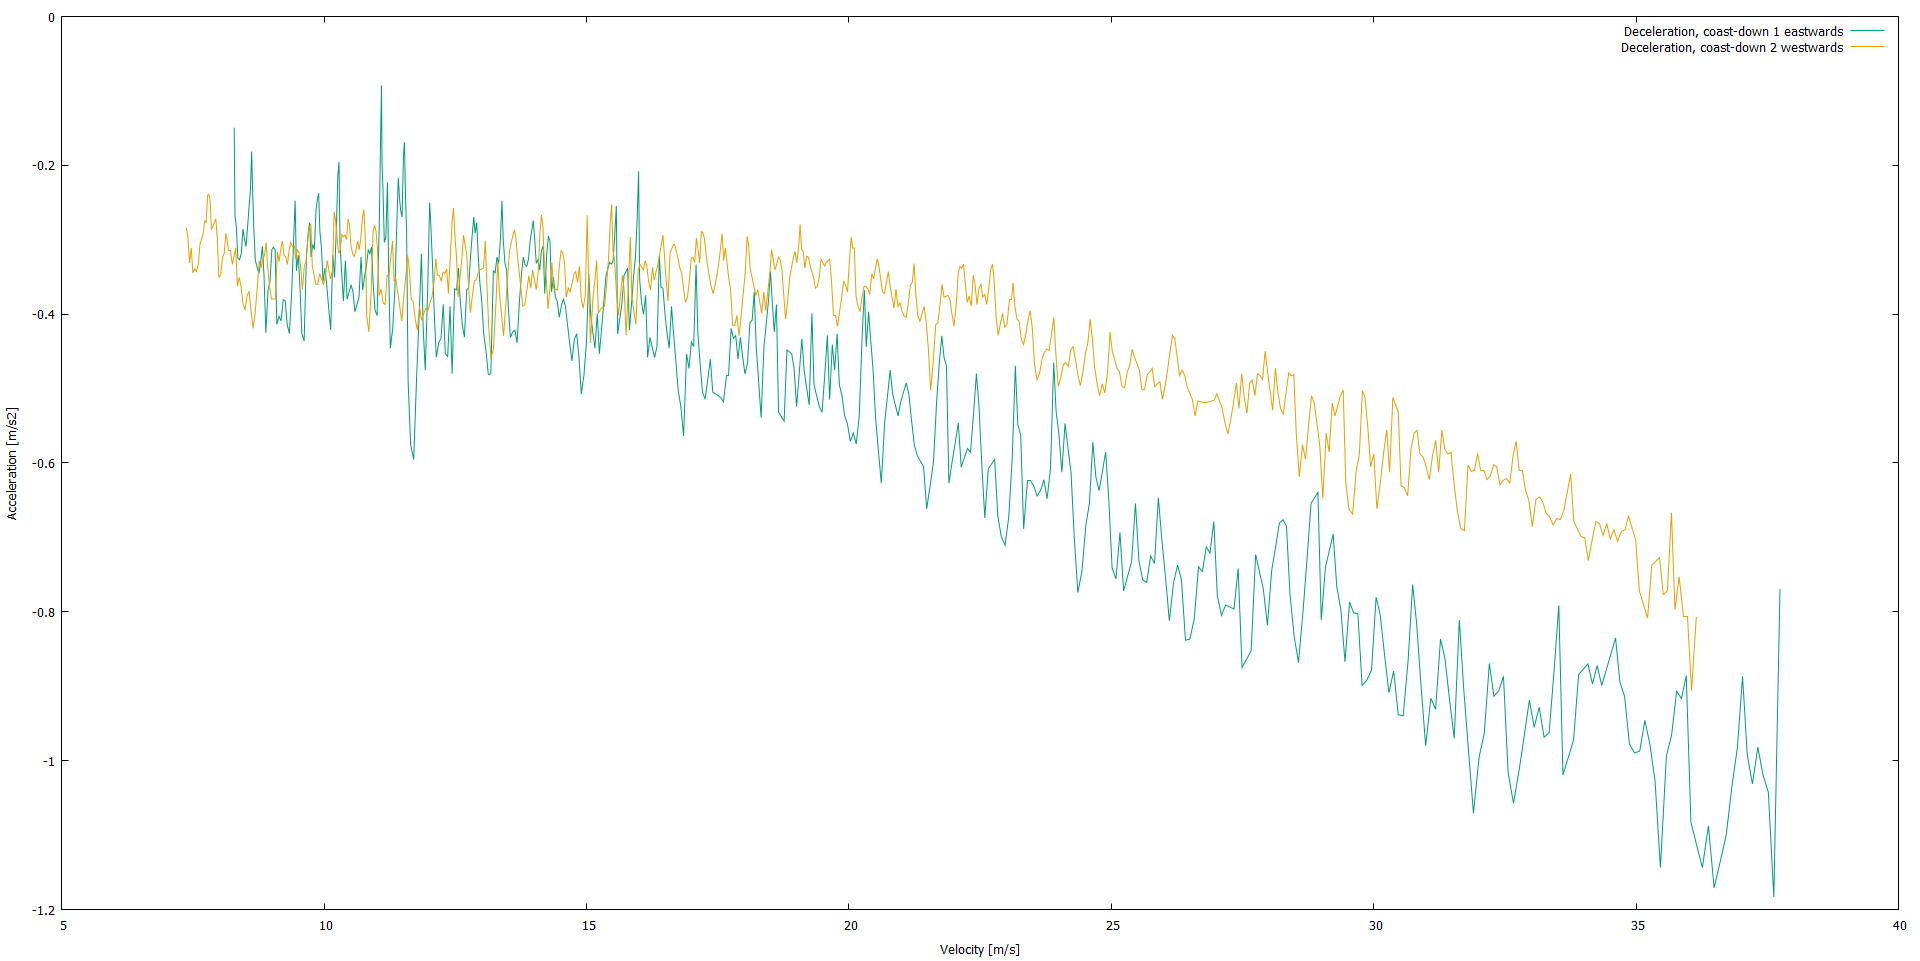
A bit noisy, but that's to expect when looking at any acceleration data derived from speed data. Now, since the wind in the direction of the road was 3-4 m/s, let's add 3.5 m/s to the run with headwind, and subtract 3.5 m/s from the run with tailwind.

Coooool. This data fits a simple mathematical model really well (assuming that 0.5*Cd*A*rho = 0.47, and using a constant rolling resistance of 240 N.

By gently removing some of the noise with a simple low-pass filter, one can then add the decelerating force to the accelerating force (acc and dec data from the same run, to avoid having to correct for wind speed), and calculate wheel HP by the formula P=F*v/745.7. Plotted against engine RPM, we get the following (the dip towards the end is unreliable data, since I release the throttle somewhat while changing gear):

So far, it all makes perfect sense. The MGA engine should be rated at 93 hp SAE gross, which would mean somewhere around 80-ish hp DIN on the crank. 60-65 hp on the wheels is pretty much what you would expect. I repeated these calculations for every run in both directions, and got very consistent results. I will end this post here, and in the next one I want to discuss replicating this data in AC.
I realize that there are multiple threads on a similar theme to this, but I feel that none of them seem to contain correct information, and most of them don't really deal with the connection to real life.
So I'm trying to model a car that I have access to in real life. Fun, right? Also a path to insanity, apparently. This is going to be a long thread, and potentially a bit interesting to some people and incredibly boring to others. The car is an old MGA race car.
The first thing I did was head out one evening and carry out acceleration tests and coast-down tests on a perfectly straight and flat piece of tarmac (an airplane runway). I'm using a 10 Hz GPS/GLONASS logger, which is typically pretty reliable. I did repeat runs in both directions, and took note of the wind speed at the time (7 m/s, blowing to the northwest, approx. 3-4 m/s in the direction of the runway).
So far, everything makes sense. Let's look at the coast-down tests, convert everything to m/s, and plot the deceleration as a function of speed.
A bit noisy, but that's to expect when looking at any acceleration data derived from speed data. Now, since the wind in the direction of the road was 3-4 m/s, let's add 3.5 m/s to the run with headwind, and subtract 3.5 m/s from the run with tailwind.
Coooool. This data fits a simple mathematical model really well (assuming that 0.5*Cd*A*rho = 0.47, and using a constant rolling resistance of 240 N.
By gently removing some of the noise with a simple low-pass filter, one can then add the decelerating force to the accelerating force (acc and dec data from the same run, to avoid having to correct for wind speed), and calculate wheel HP by the formula P=F*v/745.7. Plotted against engine RPM, we get the following (the dip towards the end is unreliable data, since I release the throttle somewhat while changing gear):
So far, it all makes perfect sense. The MGA engine should be rated at 93 hp SAE gross, which would mean somewhere around 80-ish hp DIN on the crank. 60-65 hp on the wheels is pretty much what you would expect. I repeated these calculations for every run in both directions, and got very consistent results. I will end this post here, and in the next one I want to discuss replicating this data in AC.